


Technical Indicators for Day Trading That Matter

Technical Indicators for Day Trading That Matter

The chart can look perfect at 9:42 a.m. and still fail by 9:45. That is why technical indicators for day trading are not prediction machines. They are decision tools. Used with price, volume, and a prepared trade plan, they help you identify which stocks deserve attention and which apparent opportunities are just intraday noise.

The mistake is not using indicators. The mistake is using six of them to avoid making one clear decision. A disciplined trader should be able to answer three questions quickly: Is this stock in play? Is the setup confirming? Where is the trade invalidated?

Start With Price and Volume

Indicators are calculations based on market data. Price and volume are the underlying evidence. If a stock has no meaningful catalyst, no relative volume, and no clean price structure, adding an oscillator will not create an edge.

Before the opening bell, narrow the universe. Look for stocks with a reason to move, sufficient liquidity, and a measurable premarket range. Then define the important levels: prior-day high and low, premarket high and low, opening range, and areas where price previously held or failed.

Volume tells you whether a move has participation. A breakout through a major level on thin volume deserves skepticism. A pullback that holds above a key level while volume contracts may show that sellers are losing urgency. Context matters more than a single indicator reading.

This is where ranked watchlists earn their place. Your time is finite. A structured process should move the strongest candidates to the top before the market opens rather than forcing you to scan hundreds of charts after the move has started.

The Technical Indicators for Day Trading Worth Using

Most intraday traders do not need more indicators. They need a small set that serves distinct jobs: trend context, momentum confirmation, participation, and risk management.

VWAP: The Intraday Reference Point

Volume-weighted average price, or VWAP, is one of the most useful references for liquid stocks during the regular session. It shows the average price paid, weighted by volume, and often acts as a line traders watch for intraday control.

When price holds above a rising VWAP after an opening pullback, buyers may still control the session. When price repeatedly rejects VWAP from below, rallies may be vulnerable. Neither condition guarantees direction. VWAP works best when it agrees with the broader structure, such as a stock reclaiming a premarket level with expanding volume.

Do not treat every VWAP touch as an entry. A choppy stock can cross it repeatedly and punish anyone who treats the line as automatic support or resistance. Watch the reaction: speed, volume, candle closes, and whether price can hold the level after testing it.

Moving Averages: Trend and Structure, Not Magic Lines

Short-term moving averages, including the 9-period and 20-period exponential moving averages, help traders see whether a move is maintaining momentum. On a one-minute or five-minute chart, a stock respecting a rising short-term average can offer a cleaner pullback framework than chasing an extended candle.

The trade-off is lag. Moving averages react after price moves, so they are weaker in sudden reversals and range-bound action. Use them to frame structure, not to replace it. If a stock breaks below its moving average but remains above VWAP and a major support level, the signal is different from a breakdown that loses all three.

Relative Volume: Find Stocks That Are Actually in Play

Relative volume compares current trading activity with a stock's typical volume for the same period. It helps separate a routine fluctuation from a session drawing unusual attention.

High relative volume does not mean buy. It means investigate. A stock can attract huge volume because it is breaking out, unwinding a crowded trade, or reacting violently to bad news. The opportunity comes from combining participation with a defined setup and controlled risk.

For day traders, this is especially valuable in premarket preparation. A liquid stock trading several times its usual morning volume is more likely to offer tradable movement than a quiet name with an attractive-looking indicator crossover.

RSI: Measure Momentum, Then Check the Setup

The relative strength index, or RSI, measures the speed and magnitude of recent price changes. Traders often label readings above 70 as overbought and below 30 as oversold. Those labels are useful only when you understand the trend.

A strong stock can remain overbought while continuing higher. Shorting it solely because RSI is elevated is a common way to fight momentum. In a strong uptrend, an RSI pullback that stabilizes while price holds a key level may be more useful than the high reading itself.

RSI is better for asking whether momentum is expanding, fading, or diverging from price. It is not a substitute for a stop or a reason to ignore volume.

MACD: A Secondary Momentum Check

MACD tracks the relationship between moving averages and is often used to spot momentum shifts. It can be helpful on five-minute charts when a trader wants confirmation that a developing move has gained or lost force.

Its weakness is the same as every average-based indicator: it lags. By the time a crossover appears, the cleanest entry may be gone. Use MACD as secondary confirmation, particularly in orderly trends. In fast opening volatility, price action and volume usually provide faster information.

Build a Repeatable Indicator Stack

A useful indicator stack is simple enough to execute under pressure. For example, a momentum trader might use relative volume to find active stocks, key premarket levels to map opportunity, VWAP to judge intraday control, and a short-term moving average to manage a pullback entry.

That is enough information to form a trade thesis. Suppose a stock has unusual premarket volume, breaks above its premarket high, and pulls back without losing VWAP. If it then reclaims the breakout level with volume, the entry has multiple forms of confirmation. The stop can sit below the pullback low or another clearly defined invalidation level.

Now change one condition. The stock breaks the premarket high but immediately falls below VWAP on heavy selling volume. The original long thesis is weakened. The correct response is not to add another indicator. It is to stand aside, reduce risk, or wait for the chart to prove that buyers can regain control.

If your edge cannot be measured, it is not an edge. Track the setup, time of day, indicator alignment, entry, stop, exit, and result. Over a meaningful sample, you may learn that VWAP reclaim trades work best only in stocks with strong relative volume, or that your moving-average pullbacks fail most often during midday compression. That data is more valuable than a favorite indicator.

Match the Indicator to the Market Regime

No technical tool works equally well in every environment. Trend indicators perform better when a stock has a sustained directional move. Oscillators can be more useful in established ranges. During the first minutes after the open, spreads, volatility, and rapid reversals can make every indicator look late.

Time frame also changes the interpretation. A five-minute VWAP hold may support a longer intraday trade, while a one-minute chart can help refine an entry. A signal that appears clean on one chart but contradicts the higher time frame deserves caution.

Avoid forcing the same play onto every stock. A large-cap stock with deep liquidity may respect intraday levels differently than a low-float, news-driven name. The goal is not to find an indicator that is always right. The goal is to recognize the conditions where your tested setup has the best odds.

Use Indicators to Define Risk Before You Enter

The strongest use of an indicator is often defensive. It helps define when you are wrong. If your long setup depends on a VWAP hold, a decisive loss of VWAP may invalidate it. If your thesis requires a breakout above a prior high, price falling back below that level can tell you the breakout failed.

Set the risk before clicking buy or sell. Know the entry trigger, stop level, first target, and maximum position size. If the distance to a logical stop is too wide for your risk limit, skip the trade or reduce size. A setup is not compelling because it moves fast. It is compelling when the potential reward justifies the defined risk.

Most Excellent Investor is built around this principle: prepare before the market opens, prioritize measurable candidates, and use real-time confirmation to execute with discipline rather than reaction.

Technical indicators should make your process clearer, not more crowded. Keep the chart focused. Let price and volume establish the facts. Then use a few tested tools to confirm the setup, control risk, and wait for the trades that fit your plan. The next clean opportunity is always worth more than forcing the one in front of you.

Most Excellent Investor membership

This material is for educational and informational purposes only and is not investment advice. Trading involves risk, including the possible loss of principal.


Pre Market Stock Scanner for Better Opens

Pre Market Stock Scanner for Better Opens

At 9:20 a.m., the problem is rarely a lack of stock ideas. It is too many of them. A pre market stock scanner turns a sprawling list of overnight gainers, news headlines, and unusual volume into a smaller field of stocks worth preparing to trade. That distinction matters. The goal is not to chase the biggest percentage move. The goal is to identify the names with enough liquidity, catalyst, structure, and relative interest to justify your attention when the bell rings.

A scanner is only as useful as the decisions it helps you make. If it produces 80 tickers and no plan, it has added noise. If it helps you arrive at the open with a ranked watchlist, clear price levels, and defined invalidation points, it has done its job.

What a Pre Market Stock Scanner Should Find

Pre-market action is information, not an automatic trade signal. A stock moving 25% before the open may be setting up a strong continuation move. It may also be a thinly traded name with a wide spread, a temporary headline reaction, or a move that has already exhausted its available buyers.

The scanner's job is to surface candidates. Your job is to determine whether the move is tradable.

Start with stocks showing a meaningful combination of price movement and pre-market volume. A 10% gap on minimal volume has a different quality than a 6% gap with sustained, expanding turnover. Volume shows participation. It does not guarantee direction, but it helps separate a visible market event from a print that may disappear at the open.

Next, look for a catalyst you can explain in one sentence. Earnings, guidance, a regulatory decision, merger news, an analyst action, or sector-wide momentum can create a legitimate reason for repricing. A vague social-media rumor does not carry the same weight. You do not need to predict whether the news is good enough for a 30% move. You need to know what the market is reacting to and whether the reaction is attracting real participation.

Price, volume, and catalyst are the starting point. Liquidity and structure decide whether a candidate belongs on your final watchlist.

Build the Scanner Around Tradeability

A common mistake is scanning for excitement rather than execution. The top percentage gainer is often the stock with the worst spread, shallowest order book, and least reliable price behavior. That can be useful information, but it is not automatically an opportunity.

Use filters that reflect how you actually trade. If you trade liquid listed stocks, require a minimum price, meaningful average daily volume, and enough pre-market volume to support orderly entries and exits. If low-float momentum is part of your strategy, you may accept more volatility, but you still need a clear risk rule for spreads, halts, and failed breakouts.

Relative volume deserves more attention than raw volume alone. Five hundred thousand shares may be substantial for one stock and irrelevant for another. When activity is elevated compared with the stock's normal pace, it tells you the market is paying attention. Combine that with a visible catalyst and a clean chart location, and you have a stronger candidate than a random ticker flashing green.

Also scan for downside movement. Traders who only look for pre-market winners miss half the opportunity set. Earnings misses, lowered guidance, sector weakness, and failed prior-day momentum can create short-side setups. The same standard applies: find liquid names, understand the catalyst, and wait for price action to confirm your thesis.

Rank Candidates Instead of Collecting Tickers

Your watchlist should be a decision tool, not a trophy case for stocks that moved overnight. Rank candidates by the factors that matter to your process: catalyst quality, relative volume, liquidity, pre-market trend, key technical levels, and alignment with the broader market or sector.

This ranking forces a useful question: which two or three stocks deserve the majority of your focus? A trader watching 15 charts at the opening bell is usually reacting late. A trader monitoring three well-researched candidates can observe price behavior, manage risk, and execute without rushing.

A platform such as Most Excellent Investor is built around this discipline: narrowing a broad universe into ranked, measurable trade candidates before the market opens. The value is not a stock tip. It is a repeatable way to prioritize where your attention goes.

Ranking should not be static. A stock that looked like the leading setup at 8:30 a.m. can lose volume, break a key pre-market level, or be overtaken by a stronger peer before 9:30. Update the order as new evidence arrives. The market does not care which ticker was first on your list an hour ago.

Turn Scan Results Into an Opening Plan

A scan becomes actionable when each top candidate has a written if-then plan. You do not need a long market thesis. You need to know what would make you enter, where the trade is wrong, and where the next decision point sits.

For a gap-up stock, mark the pre-market high, pre-market low, prior day's high and low, the prior close, and any major daily-chart support or resistance nearby. Then ask whether the stock is holding gains, compressing under resistance, fading toward support, or trading erratically in a wide range.

The opening range can provide confirmation, but it should not replace preparation. If your plan is to trade a break above the pre-market high, decide in advance what valid confirmation means. It may be a clean reclaim after an opening pullback, expanding volume through the level, or a hold above the level rather than a one-second spike. The exact trigger depends on your strategy. The discipline is deciding before emotion takes over.

Equally important, define the trade you will not take. If the spread is too wide, the stock opens far beyond your planned entry, volume disappears, or the price loses its critical level, stand aside. Missing a trade is not a loss. Forcing a trade because a ticker appeared on your scanner often is.

Read the Market Around the Stock

No stock trades in a vacuum at the open. Index futures, interest-rate sensitivity, sector strength, and market-wide risk appetite can influence whether an otherwise clean setup follows through. A strong earnings gap in a weak technology tape may still work, but it carries a different burden of proof than the same gap in a supportive sector.

Use the broader market as context, not an excuse to ignore a stock's own price action. If the S&P 500 is flat while a stock holds a large gain on persistent volume after strong earnings, relative strength is visible. If the market opens firm and your candidate cannot hold its pre-market high, that weakness is visible too.

Watch comparable names. When several companies in the same industry report news or move together, the leader may offer the cleanest setup, while laggards can reveal whether the move has real sector support. This comparison can keep you from trading a second-rate name simply because it appeared first in your scan.

Avoid the Scanner Traps

The first trap is treating a pre-market percentage change as proof of momentum. Pre-market trading occurs with less participation and can produce dramatic moves that do not survive regular-hours liquidity. Respect the data, but wait for your setup.

The second is using a scanner without a rejection process. Every filter should remove something: illiquid stocks, unexplained moves, names with poor risk-to-reward, or candidates too extended from a logical entry. If your edge cannot be measured, it is not an edge.

The third is confusing speed with urgency. Faster information can improve preparation, but it can also accelerate bad decisions. Timestamped signals, transparent criteria, and performance tracking matter because they let you review what happened after the trade. Over time, that review shows whether your filters are producing quality or merely producing activity.

Finally, do not let a strong scan replace risk management. Pre-market setups can gap through stops, reverse sharply after the bell, and become volatile around halts or fresh news. Position size should reflect that reality. A high-conviction setup is not permission to abandon defined risk.

Make Pre-Market Preparation a Daily Advantage

The strongest pre-market routine is not complicated. Scan the market, verify the reason for the move, rank the tradeable candidates, map the key levels, and write your conditions for entry and exit. Then let the opening price action decide whether the plan earns execution.

That process will not eliminate losing trades. It will eliminate many unplanned ones. Tomorrow morning, do not ask which stock is moving the most. Ask which stock gives you the clearest, measurable decision when the market opens.

Most Excellent Investor membership

This material is for educational and informational purposes only and is not investment advice. Trading involves risk, including the possible loss of principal.
Stocks to Watch Today: How to Build a Tradeable List

Stocks to Watch Today: Build a Tradeable List

At 9:22 a.m., the question is not whether the market will produce a move. It is whether you already know which names deserve your attention when it does. The best stocks to watch today are not the tickers making the loudest headlines. They are the small group with a measurable reason to move, enough liquidity to trade cleanly, and a setup that gives you a defined decision point.

A daily watchlist is not a prediction sheet. It is a working document for execution. Its job is to reduce thousands of listed stocks to a manageable group you can track before the opening bell, during the first hour, and into the afternoon if the trend remains intact. If your list is too broad, you are scanning. If it is focused and ranked, you are preparing.

Start With the Market, Not the Ticker

Every individual setup trades inside a broader market environment. A strong earnings gap can still fail when the indexes are under sustained selling pressure. A modest breakout can travel farther than expected when risk appetite is broad and sector participation is expanding. Context does not replace a setup, but it tells you how much follow-through the setup may reasonably receive.

Before ranking individual names, assess the market’s condition. Look at index futures, major support and resistance areas, recent volatility, and whether leadership is concentrated in a few large-cap names or spreading across sectors. Also note scheduled catalysts such as inflation reports, Federal Reserve decisions, employment data, and major Treasury auctions. These events can change price behavior quickly, especially during the opening hour.

The goal is not to call the entire session correctly. It is to set expectations. In a choppy, low-conviction market, favor selective setups, smaller risk, and faster profit-taking. In a market showing broad momentum and constructive participation, high-quality continuation and breakout candidates may deserve more room. The same chart can require a different approach depending on the tape.

How to Find Stocks to Watch Today

A useful watchlist begins with filters that identify unusual activity, then applies judgment to separate opportunity from noise. Price movement alone is not enough. A stock can be up 20% and still be a poor trade candidate if volume is thin, the spread is wide, or the move has no catalyst beyond a social-media rumor.

Look for a reason the stock is moving

Catalysts create attention, and attention can create liquidity and momentum. Earnings, guidance revisions, analyst changes, mergers, regulatory decisions, product announcements, contract wins, litigation outcomes, and sector-wide news can all put a stock in play.

But not all catalysts carry equal weight. The market cares about the difference between an earnings beat and a beat paired with raised forward guidance. It cares whether a contract award changes revenue expectations or simply confirms an existing relationship. It cares whether a regulatory headline is definitive or merely another step in a long process.

Read beyond the headline. Determine what is new, whether the news changes the company’s outlook, and whether premarket price action confirms that traders view it as meaningful. This prevents a common mistake: treating every news-driven gap as a momentum opportunity.

Demand liquidity before you demand excitement

Liquidity is a trading requirement, not a bonus. It affects entries, exits, slippage, and your ability to manage risk when the trade does not work. Stocks with strong relative volume, consistently active trading, and tight bid-ask spreads are generally easier to execute than thin names with dramatic percentage moves.

Premarket volume matters, but it needs context. A stock trading several hundred thousand shares before the open may be highly active for a smaller company and irrelevant for a mega-cap. Compare current activity with the stock’s normal daily volume. Relative volume reveals whether today is truly different.

Be particularly cautious with low-float stocks that gap aggressively. They can move quickly in both directions, and the chart may look compelling until liquidity disappears. Volatility is not the same as tradability. If you cannot define a clean entry, stop level, and realistic exit, the ticker has not earned a place at the top of your list.

Let the chart define the opportunity

Once a stock has a real catalyst and adequate liquidity, the technical structure determines whether it is actionable. Focus on locations where price can prove or disprove your thesis quickly: a premarket high, a key daily moving average, prior-day high or low, a multi-day consolidation, or an obvious intraday support level.

A quality setup does not mean a guaranteed move. It means the trade has recognizable structure. For example, a stock holding above a major premarket level on expanding volume may offer a continuation thesis. A stock that gaps into prior daily resistance, loses volume, and repeatedly fails to hold its opening range may be setting up very differently.

Avoid treating indicators as substitutes for price action. Moving averages, relative strength, volume-weighted average price, and momentum readings can improve your read, but they should support the setup rather than invent one. The cleanest trades usually make sense on the chart before an indicator confirms them.

Define risk before the opening bell

The most overlooked part of a watchlist is invalidation. Every candidate should have a clear answer to one question: what would tell me this idea is wrong? Without that answer, traders tend to turn a planned trade into an emotional hold.

Set the levels that matter before price becomes fast and noisy. Identify the potential entry area, the level that invalidates the setup, the first logical target, and the conditions that would keep you out entirely. A gap-up stock that opens below your key support is not automatically a bargain. It may simply be a failed premise.

Position size should follow the distance to your stop, not your confidence in the story. Strong conviction without controlled downside is just optimism with a chart attached. If your edge cannot be measured, it is not an edge.

Rank the List So Attention Goes to the Best Setups

A list of 30 tickers is not a watchlist. It is another source of noise. The practical goal is to rank candidates so you know where to focus when multiple names move at once.

Give each stock a simple, repeatable score based on catalyst quality, relative volume, liquidity, technical structure, market alignment, and clearly defined risk. You do not need to pretend every input has perfect precision. You need a consistent process that makes the trade-offs visible.

A stock with exceptional news but poor chart structure may belong in a secondary group. A technically clean stock without a catalyst may be worth monitoring, but it should not automatically outrank a liquid, news-driven name showing institutional-level volume. Ranking forces you to make these distinctions before the market pressures you into impulsive decisions.

At Most Excellent Investor, the point of ranked daily research is not to hand traders a magical ticker. It is to turn a broad market scan into a prioritized decision framework supported by measurable criteria, timestamped signals, and transparent performance comparisons.

Turn Each Watchlist Name Into a Trade Plan

A ticker becomes useful only when it has a specific plan attached to it. Write the scenario in plain language. For a long setup, that may mean: hold above the premarket high after the opening volatility settles, reclaim volume-weighted average price, and expand through the first resistance level. For a short setup, it may mean: fail to hold the opening range, reject a key resistance area, and break support with confirming volume.

The plan should also state what you will not do. Do not chase a stock that is already extended from the level you planned to use. Do not enter simply because another trader calls out the ticker. Do not average down because the original stop feels inconvenient. These are not minor discipline issues. They are the behaviors that erase the benefit of good research.

Keep the plan conditional. Markets do not owe you a clean entry, and some of the best watchlist names will never trigger. Passing on a trade because your condition did not appear is a successful act of execution, not a missed opportunity.

The Watchlist Mistakes That Cost Traders Most

The first mistake is confusing activity with quality. A stock can dominate financial television, trend online, and still offer no clean risk-reward. The second is adding names after the open without a process. Late additions often come from fear of missing out rather than a verified setup.

Another mistake is failing to update the list as information changes. A premarket leader that cannot hold key levels after the open may no longer deserve attention. Conversely, a secondary candidate can move higher in priority when it shows unexpected relative strength, volume expansion, and a clean break from consolidation. Preparation is essential, but it is not rigidity.

Finally, do not measure your watchlist only by whether every stock went up or down. Measure whether it identified liquid, relevant names; whether your planned levels were useful; whether signals held up against the S&P 500 environment; and whether you followed your rules. Process data is more valuable than selective memory.

Tomorrow’s opportunities will arrive whether or not you chase today’s. Prepare before the market opens, focus on what can be measured, and let clean confirmation earn your capital.

Most Excellent Investor membership

This material is for educational and informational purposes only and is not investment advice. Trading involves risk, including the possible loss of principal.
How to Identify a Good Growth Stock for Investment

Identifying a good growth stock involves evaluating several key factors. Here are 7 steps to help you identify promising growth stocks:

  1. Revenue Growth: Look for companies with consistent and strong revenue growth. This indicates that the company is expanding its market share and increasing its sales.
  2. Earnings Growth: Check the company’s earnings growth over time. A good growth stock should show a steady increase in earnings per share (EPS).
  3. Competitive Advantage: Identify companies with a strong competitive edge, such as unique products, strong brand recognition, or proprietary technology. This helps ensure they can maintain growth over the long term.
  4. Market Trends: Focus on companies that are well-positioned to benefit from long-term market trends. This could include sectors like technology, healthcare, or renewable energy
  5. Management Quality: Evaluate the company’s management team. Experienced and visionary leaders are crucial for driving growth and navigating challenges.
  6. Large Addressable Market: Look for companies with a large and growing addressable market. This provides more opportunities for the company to expand its customer base and increase sales.
  7. Financial Health: Ensure the company has a strong balance sheet with manageable debt levels. This allows the company to invest in growth opportunities without financial strain.

Most Excellent Investor members already can find stocks meeting the above criteria in curated watchlists. Sign up here if not already a member, or if you are a member you can login from the menu at the top of this page.

This material is for educational and informational purposes only and is not investment advice. Trading involves risk, including the possible loss of principal.
7 Tactical Trading Habits to Master Volatile Markets (Proven by Active Traders)

7 Tactical Trading Habits to Master Volatile Markets

When the stock market gets unpredictable, disciplined traders win. Volatility can be your edge—if you follow proven rules to manage risk, stay focused, and take high-probability setups.

Here are 7 habits top traders use to stay consistent and profitable even during turbulent market conditions.


1. Use Hard Stop-Losses on Every Trade

Never enter a trade without a pre-set stop-loss. Risking more than 2% of your account on a single trade can be catastrophic in a volatile environment.

2. Mentally Reset After Every Trade

Successful traders treat every trade as a new opportunity. Whether you win or lose, reset your mindset before entering the next position.

3. Stay in Cash When There’s No Edge

Cash isn’t idle—it’s strategic. Waiting for clear setups helps you avoid overtrading and emotional decisions.

4. Only Take High-Probability Setups

Stick to proven criteria: volume surge, breakout level, trend confirmation. Skip marginal trades.

5. Lock In Profits on Green Days

Stop trading after 1–2 strong trades. Many traders turn green mornings into red afternoons by overreaching.

6. Track Every Trade in a Journal

Log your entry, exit, thesis, and result. Reviewing trades regularly reveals patterns, mistakes, and your real edge.

7. Do Your Prep Before the Market Opens

Check economic reports, premarket movers, and build a focused watchlist. Don’t let news cycles distract you after the bell rings.


Bonus Tip: Use Smart Watchlists

Save time and boost focus by using curated stock watchlists. At MostExcellentInvestor.com, we provide ranked, trade-ready stocks using both technical and fundamental analysis. It’s a smart way to enter the market with confidence.

This material is for educational and informational purposes only and is not investment advice. Trading involves risk, including the possible loss of principal.
Crypto Trading vs. Equity Trading: A Comparative Analysis

In recent years, cryptocurrency trading has surged into the mainstream, challenging traditional equity markets for attention, participation, and investment capital. While both asset classes involve buying and selling for potential profit, the underlying mechanics, risk profiles, regulatory frameworks, and market behaviors differ considerably. Understanding these differences is essential for investors navigating today’s dynamic financial landscape.

Market Accessibility and Trading Hours

One of the most noticeable distinctions between crypto and equity trading is market accessibility. Equity markets—such as the New York Stock Exchange (NYSE) and NASDAQ—operate during regular business hours (typically 9:30 AM to 4:00 PM ET on weekdays) and are closed on weekends and public holidays. In contrast, cryptocurrency markets operate 24/7, 365 days a year. This constant availability appeals to global investors and traders who may want to react to breaking news or take advantage of market volatility at any time.

While 24/7 access offers flexibility, it also introduces challenges. Constant market activity can lead to fatigue and the temptation for impulsive trades, particularly among retail investors. Equity markets, by virtue of their structure, offer natural breaks and pre/post-market trading windows, which can allow for more measured decision-making.

Volatility and Risk Profile

Cryptocurrencies are famously volatile. Double-digit percentage swings within a single day are not uncommon for major coins like Bitcoin or Ethereum, and lesser-known altcoins can be even more erratic. This high volatility creates opportunities for significant returns but also exposes traders to substantial risk.

Equities tend to be less volatile, especially large-cap stocks with well-established financials and operations. While stocks can also exhibit sudden price changes, these are often tied to earnings reports, economic data, or geopolitical events. The more predictable nature of stock movements, particularly in blue-chip or dividend-paying companies, attracts risk-averse investors seeking long-term value.

Regulatory Environment

Another key difference lies in regulation. Equity markets are heavily regulated, with oversight by governmental bodies like the U.S. Securities and Exchange Commission (SEC). These regulations ensure investor protections, require public disclosures from companies, and enforce insider trading laws. Brokerages are also subject to strict compliance standards, including Know Your Customer (KYC) and Anti-Money Laundering (AML) rules.

The crypto market, by contrast, exists in a regulatory gray zone. While some jurisdictions (such as the U.S., EU, and Singapore) are gradually implementing crypto-specific regulations, the market overall remains less transparent and more susceptible to fraud, manipulation, and rug pulls. The lack of standardized reporting and inconsistent global policies present both a challenge and an opportunity for reform-minded investors.

Instruments and Strategies

In equity trading, investors have access to a wide array of instruments beyond common stock, including options, futures, ETFs, and mutual funds. Strategies can range from long-term investing and dividend harvesting to high-frequency algorithmic trading.

Crypto traders also have a growing set of tools at their disposal. Derivatives like futures and perpetual swaps are now commonplace on major crypto exchanges. Additionally, the rise of decentralized finance (DeFi) has introduced novel financial instruments such as yield farming, staking, and liquidity provisioning, which have no direct parallel in traditional markets.

Despite these advancements, the crypto market’s relative immaturity means many instruments lack the depth, liquidity, or regulatory assurance found in traditional financial markets.

Technology and Innovation

Crypto trading is at the forefront of technological innovation. Blockchain technology enables trustless transactions, decentralized exchanges (DEXs), and peer-to-peer finance. Innovations like tokenization, smart contracts, and automated market makers (AMMs) are reshaping how financial transactions are executed and settled.

Equity markets are also technologically advanced, but with more emphasis on stability, compliance, and high-frequency execution. While traditional markets increasingly adopt AI, machine learning, and blockchain-based settlement systems, they often do so at a slower pace due to regulatory oversight and legacy systems.

Investor Profiles

Crypto attracts a younger, more tech-savvy demographic that often embraces risk and innovation. Many investors enter the crypto space with a speculative mindset, aiming for rapid gains. Equities, on the other hand, attract a broader demographic, including institutional investors, pension funds, and individuals focused on long-term capital appreciation and retirement planning.

Conclusion

While both crypto and equity trading offer opportunities for profit, they cater to different investor goals and risk appetites. Crypto trading is characterized by high volatility, technological innovation, and round-the-clock markets, appealing to agile, risk-tolerant traders. Equity markets offer regulatory clarity, relative stability, and a rich history of wealth accumulation through diversified investment.

Ultimately, the decision between trading crypto or equities—or balancing both—depends on individual goals, risk tolerance, and investment strategy. As both markets evolve, savvy investors who understand their differences will be best positioned to take advantage of their unique strengths.


This material is for educational and informational purposes only and is not investment advice. Trading involves risk, including the possible loss of principal.
Crypto Trading vs. Equity Trading: What’s the Right Fit for You?


📰 MARKET MINDS MONTHLY
Your Trusted Insight on Markets & Strategy


🔍 FEATURED INSIGHT

Crypto Trading vs. Equity Trading: What’s the Right Fit for You?

As digital assets continue to mature and traditional markets evolve, more investors are asking: Should I trade crypto or equities—or both? This month, we break down the key differences between the two to help you make smarter, more strategic decisions.


🕒 MARKET HOURS: Access & Flexibility

  • Crypto: 24/7, 365 days a year. Trade anytime, anywhere—ideal for global investors.
  • Equities: Weekdays only (9:30 AM – 4:00 PM ET). More structured, with natural breaks for analysis.

📌 Takeaway: Crypto offers flexibility, but the nonstop market can lead to burnout or impulsive trades.


⚡ VOLATILITY & RISK

  • Crypto: Highly volatile. Sudden price swings are common—even for major coins.
  • Equities: Generally, more stable. Blue-chip stocks and ETFs offer lower-risk options.

📌 Takeaway: Crypto rewards risk-takers, while equities suit long-term, risk-conscious investors.


🛡️ REGULATION & SECURITY

  • Equities: Heavily regulated (SEC, FINRA, etc.). Transparency and investor protections are built in.
  • Crypto: Light regulation, with ongoing global efforts to standardize rules. Still prone to scams and manipulation.

📌 Takeaway: Equities provide stronger regulatory assurance. Crypto is still finding its footing.


🧰 TOOLS & STRATEGIES

  • Equities: Stocks, ETFs, options, futures, and mutual funds—many routes to build a portfolio.
  • Crypto: Spot trading, futures, staking, yield farming, and DeFi instruments.

📌 Takeaway: Crypto has innovative tools, but they often come with complexity and risk. Equities offer depth and liquidity.


🧠 WHO’S TRADING?

  • Crypto: Younger, tech-savvy, often risk-tolerant individuals seeking quick gains or innovation.
  • Equities: Broad demographic—retail investors, institutions, retirement funds—all looking for growth or stability.

📌 Takeaway: Know your risk appetite. Your profile can help guide your platform of choice.


💡 QUICK COMPARISON SNAPSHOT

Category Crypto Equities
Market Hours 24/7 Weekdays, business hours
Volatility Very High Moderate to Low
Regulation Light & Evolving Robust & Established
Instruments Innovative (DeFi, NFTs) Diverse (Stocks, ETFs)
Investor Base Younger, speculative Broad, strategic

🧭 FINAL THOUGHT

There’s no one-size-fits-all answer. Crypto and equity markets serve different purposes—and often, the smartest investors diversify across both. Whether you lean into innovation or prefer stability, understanding each landscape is the key to better investing.


📬 Liked this article? Forward it to a friend or colleague who’s exploring new markets.

Want deeper insights like this one?
📩 Come back often to MostExcellentInvestor.com for expert breakdowns and exclusive trend analysis.


For insights into trading stocks specifically see this article: A Beginner’s Fastest Journey to Profitable Stock Trading – Most Excellent Investor

To get a head start (cheat sheet advantage) on your stock research get access to MostExcellentInvester.com profitable stock watchlists here: Sales Information For Silver – Most Excellent Investor

Maximizing Profits: Trading the Stock Market from the Open to the High

Maximizing Profits: Trading the Stock Market from the Open to the High

Trading stocks from the market open to the high of the day is a strategy many traders use to capture early momentum and maximize profits. This approach, often referred to as the "morning rally," is particularly effective because of the high volatility and volume that occur in the first hour of trading. This article will explore why this strategy is advantageous and how traders can execute it successfully.

Why Trade from the Open to the High?

1. High Volatility and Volume

The stock market experiences its most significant price movements in the first hour of trading. This period sees an influx of orders from institutional and retail traders acting on overnight news and pre-market developments. The high liquidity ensures quick order execution and minimal slippage, which is critical for short-term traders.

2. Capturing Early Momentum

The initial price movement in many stocks tends to be the strongest of the day. If a stock opens with positive news or strong pre-market activity, it often experiences a rapid surge, reaching its daily high within the first hour. By targeting this move, traders can capitalize on a substantial portion of the day's price action without staying in the market too long.

3. Reduced Exposure to Risk

Holding positions for extended periods increases exposure to adverse price movements. Trading from the open to the high (which happens early for stocks used in this strategy) allows traders to enter and exit quickly, mitigating the risk of reversals or unexpected news later in the day.

4. Psychological Advantage

By focusing on a short trading window, traders can maintain better discipline and avoid overtrading. Many traders struggle with decision fatigue throughout the day, leading to poor choices. Limiting trades to the morning session enhances clarity and execution.

How to Successfully Trade from the Open to the High

1. Pre-Market Preparation

Preparation is crucial for success in this strategy. Traders should start by:

  • Scanning for stocks with high pre-market volume and significant price movement.
  • Reviewing overnight news, earnings reports, and economic data that could impact stock prices.
  • Identifying key support and resistance levels using technical analysis.
  • Checking market sentiment and futures indices to gauge overall market direction.

2. Identifying the Right Stocks

Not all stocks are suitable for this strategy. The best candidates are those with:

  • High relative volume compared to their average daily volume.
  • A strong catalyst such as earnings reports, news releases, or analyst upgrades.
  • A history of following pre-market trends into the regular session.
  • Sufficient liquidity to ensure quick order execution.

3. Using Technical Indicators

Technical indicators help confirm trade setups and entry points. Some useful indicators include:

  • VWAP (Volume Weighted Average Price): Helps identify whether a stock is trading above or below fair value.
  • Moving Averages: Short-term moving averages (e.g., 9 EMA, 20 EMA) can provide trend confirmation.
  • Momentum Indicators: RSI and MACD can help determine the strength of a move.
  • Pre-market Highs and Lows: These levels often act as support and resistance during the regular session.

4. Executing the Trade

Once the market opens, traders should:

  • Wait for confirmation of the trend rather than entering impulsively.
  • Enter the trade when the stock breaks above key resistance levels with strong volume.
  • Use a stop-loss to limit potential losses. A common placement is just below the pre-market low or a key support level.
  • Scale out of the position as the stock approaches new highs, securing profits while allowing for potential continuation.

5. Exiting at the Right Time

A disciplined exit strategy is as important as a solid entry. Traders should consider exiting when:

  • The stock reaches a predetermined resistance level or percentage gain.
  • Momentum begins to fade, indicated by decreasing volume or bearish candlestick patterns.
  • The broader market starts to reverse or show weakness.

Conclusion

Trading from the market open to the high of the day is a powerful strategy for capitalizing on early momentum, reducing risk, and maximizing profits. By conducting thorough pre-market research, selecting the right stocks, using technical indicators, and executing trades with discipline, traders can significantly improve their success rate. While no strategy is foolproof, mastering this approach can lead to consistent gains and a more structured trading routine.

Want to gain access to a list of stocks researched every night for open to high (OTH) trading? Become a Most Excellent Investor member.

This material is for educational and informational purposes only and is not investment advice. Trading involves risk, including the possible loss of principal.

Beginners Guide to Learning Stock Trading Technical Analysis

Learn Technical Analysis (Simplified for Beginners (not Dummies))

Technical analysis is the study of price movements using charts. Unlike fundamental analysis, which looks at company earnings and financials, technical analysis focuses on patterns and trends to predict future price movements.

Why is Technical Analysis Important?

✅ Helps identify the best times to buy and sell stocks.
✅ Allows traders to spot trends and avoid bad trades.
✅ Works for short-term and long-term trading.


A. Understanding Candlestick Charts (Your Trading Roadmap)

Candlestick charts are the most popular way to visualize price movements. Each "candle" represents a specific time period (e.g., 1 minute, 1 hour, 1 day) and shows:

  • Opening Price – Where the stock started.
  • Closing Price – Where the stock ended.
  • High & Low Prices – The highest and lowest prices reached.

👉 Green Candles (Bullish) – The stock closed higher than it opened.
👉 Red Candles (Bearish) – The stock closed lower than it opened.

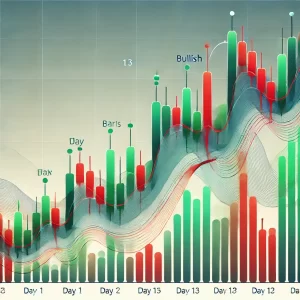
Most Excellent Investor Illustration of Candlestick Chart. The chart shows an overall upward trend with some pullbacks.
The chart shows 1-Day candles on an overall upward trend with some pullbacks.

🔹 Beginner Tip: Focus on daily charts (1-day candles) to start. Shorter timeframes (1-minute, 5-minute charts) are for advanced traders.


B. Key Candlestick Patterns Every Beginner Should Know

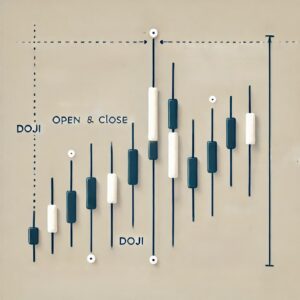
1️⃣ Doji – Market indecision; price may reverse soon.

Here is an illustration of the Doji candlestick pattern, highlighting its small or nonexistent body with long wicks, signifying market indecision.


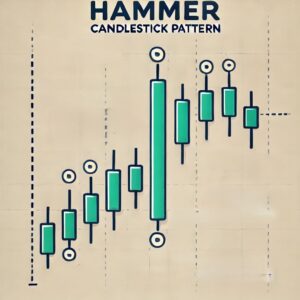
2️⃣ Hammer – Bullish reversal; the stock may go up.

Here is the illustration of the Hammer candlestick pattern, highlighting its small body at the top with a long lower wick, signaling a potential bullish reversal.
Most Excellent Investor illustration of the Hammer candlestick pattern, highlighting its small body at the top with a long lower wick, signaling a potential bullish reversal.


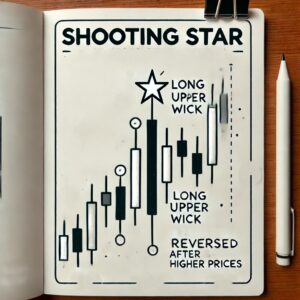
3️⃣ Shooting Star – Bearish reversal; the stock may drop.

Here’s the illustration of the Shooting Star candlestick pattern, highlighting its small body near the bottom with a long upper wick, indicating a potential bearish reversal.
Most Excellent Investor - An illustration of the Shooting Star candlestick pattern. The Shooting Star has a small body near the bottom with a long upper wick, indicating a potential reversal in price.


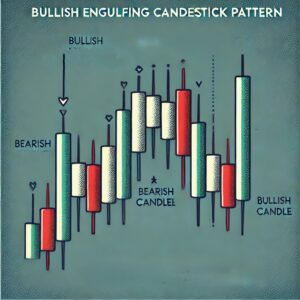
4️⃣ Engulfing Pattern – A strong signal that a trend is changing.

Most Excellent Investor illustration of the Engulfing candlestick pattern, showing bullish and bearish variations.
Most Excellent Investor illustration of the Engulfing candlestick pattern, both bullish and bearish variations.

🔹 Beginner Tip: Stick to simple patterns like the hammer and engulfing pattern to spot strong trade signals.


C. Support & Resistance (Where Prices Bounce or Break)

  • Support = A price level where stocks tend to stop falling and bounce back up.
  • Resistance = A price level where stocks tend to stop rising and drop back down.

🔹 Beginner Tip: Look for stocks that break through resistance with high volume (more buyers). This is often a good buying opportunity.


D. Simple Indicators to Predict Price Movements

Indicators help confirm trends and trading signals. Here are two beginner-friendly indicators:

1️⃣ Moving Averages (Trend Tracker)

  • Smooths out price movements to show the overall trend.
  • 50-Day & 200-Day Moving Averages – Stocks above these lines are in an uptrend; stocks below are in a downtrend.

2️⃣ Relative Strength Index (RSI) (Overbought/Oversold Indicator)

  • Measures whether a stock is overbought (70+) or oversold (30-).
  • RSI below 30 = Stock might be too cheap and ready to rise.
  • RSI above 70 = Stock might be too expensive and ready to drop.

🔹 Beginner Tip: Use the 50-day moving average to confirm trends and RSI to check if a stock is overbought or oversold before buying.


E. Putting It All Together (Simple Beginner Strategy)

Step 1: Look for a stock trading above the 50-day moving average (Uptrend).
Step 2: Check RSI – If it's near 30, the stock may be oversold (good buy opportunity).
Step 3: Look for a bullish candlestick pattern (like a Hammer) near a support level.
Step 4: Enter the trade and set a stop-loss below support to protect against losses.

🔹 Beginner Tip: Use free charting tools like TradingView or your broker’s platform to practice.


Final Thoughts on Technical Analysis for Beginners

📌 Start Simple – Focus on a few key indicators instead of learning everything at once.
📌 Practice with Paper Trading – Use demo accounts to test strategies before risking real money.
📌 Be Patient – Profitable trading comes from consistency, not guessing.

By following this structured approach, beginners can quickly develop confidence in reading charts and making better trading decisions.

How Technical Analysis fits in the whole endeavor of stock trading.

The above considerations are already contained in Most Excellent Investor researched stock watchlists, which can be accessed here.

This material is for educational and informational purposes only and is not investment advice. Trading involves risk, including the possible loss of principal.

A Beginner’s Fastest Journey to Profitable Stock Trading

Here's an introduction to a detailed consideration on the topic of profitable stock trading as a beginner:


A Beginner’s Fastest Journey to Profitable Stock Trading

Stock trading can be highly rewarding, but for beginners, it often feels overwhelming. The good news is that with the right approach, discipline, and mindset, you can accelerate your journey to profitability. This guide will take you through a structured step-by-step process to fast-track your success in stock trading while minimizing common mistakes.


Step 1: Build the Right Mindset

Why Mindset Matters

Many beginners rush into trading with dreams of quick riches, only to suffer losses due to emotional decision-making. Successful traders operate with a disciplined and strategic mindset.

Key Trading Principles to Adopt

  1. Patience Over Greed – The market rewards those who wait for the right setups rather than chasing every opportunity.
  2. Risk Management is Key – Protecting your capital is more important than making profits in the short term.
  3. Consistency Beats Luck – Small, repeatable wins are better than gambling on big, uncertain trades.

Step 2: Learn the Essential Trading Foundations

1. Understand Market Basics

Before placing your first trade, you need to know:

  • Market Participants – Retail traders, institutional investors, hedge funds, etc.
  • Types of Stocks – Growth stocks, value stocks, blue chips, penny stocks.
  • Market Orders & Trading Types – Market orders, limit orders, stop-loss, day trading, swing trading, position trading.

2. Learn Technical Analysis

Technical analysis helps traders predict price movements based on historical data. Key tools include:

  • Candlestick Patterns – Doji, engulfing, hammer, shooting star. Click here for live watchlist of stocks with this pattern.
  • Indicators – Moving averages, RSI (Relative Strength Index), MACD (Moving Average Convergence Divergence), Bollinger Bands.
  • Support & Resistance – Identifying key levels where stock prices are likely to reverse.

3. Learn Fundamental Analysis

While technical analysis focuses on price action, fundamental analysis evaluates a company’s financial health. Key metrics:

  • Earnings per Share (EPS) – Profitability of a company.
  • Price-to-Earnings Ratio (P/E Ratio) – How expensive a stock is compared to its earnings.
  • Revenue Growth & Debt Levels – Indicates a company’s ability to grow sustainably.

Step 3: Choose a Profitable Trading Strategy

1. Day Trading (Fastest But Risky)

  • Buying and selling stocks within a single day.
  • Requires speed, real-time market analysis, and risk management.
  • Suitable for those with time to monitor trades throughout the day.

2. Swing Trading (Best for Beginners)

  • Holding stocks for a few days to weeks to capture short- to medium-term trends.
  • Requires chart analysis and patience but is less stressful than day trading.
  • Works well with technical indicators like moving averages and RSI.

3. Trend Following (Long-Term Profitable Strategy)

  • Buying stocks in an uptrend and selling in a downtrend.
  • Uses moving averages and breakout strategies.
  • Less stressful and requires less screen time than day trading.

Best Strategy for Beginners? Swing trading is the most beginner-friendly way to achieve profitability quickly without the stress of day trading.


Step 4: Open a Trading Account & Start Practicing

1. Choose a Reliable Broker

A broker provides the platform to buy and sell stocks. Key factors to consider:

  • Low fees and commissions – High costs eat into profits.
  • User-friendly platform – Choose one with good charting tools and a mobile app.
  • Paper Trading Option – Allows you to trade with fake money before risking real capital.

2. Set Up a Trading Journal

Keeping a trading journal helps track progress, identify mistakes, and refine strategies. Record:

  • Entry & exit points of trades.
  • Why you entered the trade.
  • Profit/loss outcome.
  • Emotional state during the trade.

Step 5: Implement a Risk Management Plan

Avoiding large losses is the key to long-term success. Here’s how:

  • Only Risk 1-2% of Your Capital Per Trade – Never go all-in on one trade.
  • Always Use Stop-Loss Orders – Set a predefined exit if a trade goes against you.
  • Diversify Your Trades – Don't put all money into one stock or sector.

Step 6: Optimize & Scale Your Trading

1. Analyze Your Trades Weekly

Look at your trading journal and identify what’s working and what’s not.

2. Gradually Increase Capital

Once profitable with a small account, increase your trading capital while maintaining risk management.

3. Automate Strategies (Optional)

Some traders use automated systems to remove emotions from trading. Consider:

  • Using trading bots or alerts to enter trades based on predefined criteria.
  • Setting up notifications for ideal trade setups.

Conclusion: The Fastest Route to Profitability

  1. Master Trading Basics First – Don’t skip learning technical and fundamental analysis.
  2. Choose a Simple & Proven Strategy – Swing trading is often the best for beginners.
  3. Trade with Discipline & Risk Management – Avoid emotional trading.
  4. Refine Your Strategy Over Time – Keep a journal and analyze mistakes.
  5. Gradually Scale Your Profits – Increase capital only after consistent success.

Following this structured approach will significantly shorten your learning curve and help you reach profitability faster than most new traders.