
Maximizing Profits: Trading the Stock Market from the Open to the High
Trading stocks from the market open to the high of the day is a strategy many traders use to capture early momentum and maximize profits. This approach, often referred to as the "morning rally," is particularly effective because of the high volatility and volume that occur in the first hour of trading. This article will explore why this strategy is advantageous and how traders can execute it successfully.
Why Trade from the Open to the High?
1. High Volatility and Volume
The stock market experiences its most significant price movements in the first hour of trading. This period sees an influx of orders from institutional and retail traders acting on overnight news and pre-market developments. The high liquidity ensures quick order execution and minimal slippage, which is critical for short-term traders.
2. Capturing Early Momentum
The initial price movement in many stocks tends to be the strongest of the day. If a stock opens with positive news or strong pre-market activity, it often experiences a rapid surge, reaching its daily high within the first hour. By targeting this move, traders can capitalize on a substantial portion of the day's price action without staying in the market too long.
3. Reduced Exposure to Risk
Holding positions for extended periods increases exposure to adverse price movements. Trading from the open to the high (which happens early for stocks used in this strategy) allows traders to enter and exit quickly, mitigating the risk of reversals or unexpected news later in the day.
4. Psychological Advantage
By focusing on a short trading window, traders can maintain better discipline and avoid overtrading. Many traders struggle with decision fatigue throughout the day, leading to poor choices. Limiting trades to the morning session enhances clarity and execution.
How to Successfully Trade from the Open to the High
1. Pre-Market Preparation
Preparation is crucial for success in this strategy. Traders should start by:
- Scanning for stocks with high pre-market volume and significant price movement.
- Reviewing overnight news, earnings reports, and economic data that could impact stock prices.
- Identifying key support and resistance levels using technical analysis.
- Checking market sentiment and futures indices to gauge overall market direction.
2. Identifying the Right Stocks
Not all stocks are suitable for this strategy. The best candidates are those with:
- High relative volume compared to their average daily volume.
- A strong catalyst such as earnings reports, news releases, or analyst upgrades.
- A history of following pre-market trends into the regular session.
- Sufficient liquidity to ensure quick order execution.
3. Using Technical Indicators
Technical indicators help confirm trade setups and entry points. Some useful indicators include:
- VWAP (Volume Weighted Average Price): Helps identify whether a stock is trading above or below fair value.
- Moving Averages: Short-term moving averages (e.g., 9 EMA, 20 EMA) can provide trend confirmation.
- Momentum Indicators: RSI and MACD can help determine the strength of a move.
- Pre-market Highs and Lows: These levels often act as support and resistance during the regular session.
4. Executing the Trade
Once the market opens, traders should:
- Wait for confirmation of the trend rather than entering impulsively.
- Enter the trade when the stock breaks above key resistance levels with strong volume.
- Use a stop-loss to limit potential losses. A common placement is just below the pre-market low or a key support level.
- Scale out of the position as the stock approaches new highs, securing profits while allowing for potential continuation.
5. Exiting at the Right Time
A disciplined exit strategy is as important as a solid entry. Traders should consider exiting when:
- The stock reaches a predetermined resistance level or percentage gain.
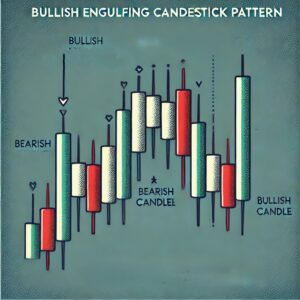
- Momentum begins to fade, indicated by decreasing volume or bearish candlestick patterns.
- The broader market starts to reverse or show weakness.
Conclusion
Trading from the market open to the high of the day is a powerful strategy for capitalizing on early momentum, reducing risk, and maximizing profits. By conducting thorough pre-market research, selecting the right stocks, using technical indicators, and executing trades with discipline, traders can significantly improve their success rate. While no strategy is foolproof, mastering this approach can lead to consistent gains and a more structured trading routine.