Crypto Trading vs. Equity Trading: A Comparative Analysis

In recent years, cryptocurrency trading has surged into the mainstream, challenging traditional equity markets for attention, participation, and investment capital. While both asset classes involve buying and selling for potential profit, the underlying mechanics, risk profiles, regulatory frameworks, and market behaviors differ considerably. Understanding these differences is essential for investors navigating today’s dynamic financial landscape.

Market Accessibility and Trading Hours

One of the most noticeable distinctions between crypto and equity trading is market accessibility. Equity markets—such as the New York Stock Exchange (NYSE) and NASDAQ—operate during regular business hours (typically 9:30 AM to 4:00 PM ET on weekdays) and are closed on weekends and public holidays. In contrast, cryptocurrency markets operate 24/7, 365 days a year. This constant availability appeals to global investors and traders who may want to react to breaking news or take advantage of market volatility at any time.

While 24/7 access offers flexibility, it also introduces challenges. Constant market activity can lead to fatigue and the temptation for impulsive trades, particularly among retail investors. Equity markets, by virtue of their structure, offer natural breaks and pre/post-market trading windows, which can allow for more measured decision-making.

Volatility and Risk Profile

Cryptocurrencies are famously volatile. Double-digit percentage swings within a single day are not uncommon for major coins like Bitcoin or Ethereum, and lesser-known altcoins can be even more erratic. This high volatility creates opportunities for significant returns but also exposes traders to substantial risk.

Equities tend to be less volatile, especially large-cap stocks with well-established financials and operations. While stocks can also exhibit sudden price changes, these are often tied to earnings reports, economic data, or geopolitical events. The more predictable nature of stock movements, particularly in blue-chip or dividend-paying companies, attracts risk-averse investors seeking long-term value.

Regulatory Environment

Another key difference lies in regulation. Equity markets are heavily regulated, with oversight by governmental bodies like the U.S. Securities and Exchange Commission (SEC). These regulations ensure investor protections, require public disclosures from companies, and enforce insider trading laws. Brokerages are also subject to strict compliance standards, including Know Your Customer (KYC) and Anti-Money Laundering (AML) rules.

The crypto market, by contrast, exists in a regulatory gray zone. While some jurisdictions (such as the U.S., EU, and Singapore) are gradually implementing crypto-specific regulations, the market overall remains less transparent and more susceptible to fraud, manipulation, and rug pulls. The lack of standardized reporting and inconsistent global policies present both a challenge and an opportunity for reform-minded investors.

Instruments and Strategies

In equity trading, investors have access to a wide array of instruments beyond common stock, including options, futures, ETFs, and mutual funds. Strategies can range from long-term investing and dividend harvesting to high-frequency algorithmic trading.

Crypto traders also have a growing set of tools at their disposal. Derivatives like futures and perpetual swaps are now commonplace on major crypto exchanges. Additionally, the rise of decentralized finance (DeFi) has introduced novel financial instruments such as yield farming, staking, and liquidity provisioning, which have no direct parallel in traditional markets.

Despite these advancements, the crypto market’s relative immaturity means many instruments lack the depth, liquidity, or regulatory assurance found in traditional financial markets.

Technology and Innovation

Crypto trading is at the forefront of technological innovation. Blockchain technology enables trustless transactions, decentralized exchanges (DEXs), and peer-to-peer finance. Innovations like tokenization, smart contracts, and automated market makers (AMMs) are reshaping how financial transactions are executed and settled.

Equity markets are also technologically advanced, but with more emphasis on stability, compliance, and high-frequency execution. While traditional markets increasingly adopt AI, machine learning, and blockchain-based settlement systems, they often do so at a slower pace due to regulatory oversight and legacy systems.

Investor Profiles

Crypto attracts a younger, more tech-savvy demographic that often embraces risk and innovation. Many investors enter the crypto space with a speculative mindset, aiming for rapid gains. Equities, on the other hand, attract a broader demographic, including institutional investors, pension funds, and individuals focused on long-term capital appreciation and retirement planning.

Conclusion

While both crypto and equity trading offer opportunities for profit, they cater to different investor goals and risk appetites. Crypto trading is characterized by high volatility, technological innovation, and round-the-clock markets, appealing to agile, risk-tolerant traders. Equity markets offer regulatory clarity, relative stability, and a rich history of wealth accumulation through diversified investment.

Ultimately, the decision between trading crypto or equities—or balancing both—depends on individual goals, risk tolerance, and investment strategy. As both markets evolve, savvy investors who understand their differences will be best positioned to take advantage of their unique strengths.


 

Crypto Trading vs. Equity Trading: What’s the Right Fit for You?


📰 MARKET MINDS MONTHLY
Your Trusted Insight on Markets & Strategy


🔍 FEATURED INSIGHT

Crypto Trading vs. Equity Trading: What’s the Right Fit for You?

As digital assets continue to mature and traditional markets evolve, more investors are asking: Should I trade crypto or equities—or both? This month, we break down the key differences between the two to help you make smarter, more strategic decisions.


🕒 MARKET HOURS: Access & Flexibility

  • Crypto: 24/7, 365 days a year. Trade anytime, anywhere—ideal for global investors.
  • Equities: Weekdays only (9:30 AM – 4:00 PM ET). More structured, with natural breaks for analysis.

📌 Takeaway: Crypto offers flexibility, but the nonstop market can lead to burnout or impulsive trades.


⚡ VOLATILITY & RISK

  • Crypto: Highly volatile. Sudden price swings are common—even for major coins.
  • Equities: Generally, more stable. Blue-chip stocks and ETFs offer lower-risk options.

📌 Takeaway: Crypto rewards risk-takers, while equities suit long-term, risk-conscious investors.


🛡️ REGULATION & SECURITY

  • Equities: Heavily regulated (SEC, FINRA, etc.). Transparency and investor protections are built in.
  • Crypto: Light regulation, with ongoing global efforts to standardize rules. Still prone to scams and manipulation.

📌 Takeaway: Equities provide stronger regulatory assurance. Crypto is still finding its footing.


🧰 TOOLS & STRATEGIES

  • Equities: Stocks, ETFs, options, futures, and mutual funds—many routes to build a portfolio.
  • Crypto: Spot trading, futures, staking, yield farming, and DeFi instruments.

📌 Takeaway: Crypto has innovative tools, but they often come with complexity and risk. Equities offer depth and liquidity.


🧠 WHO’S TRADING?

  • Crypto: Younger, tech-savvy, often risk-tolerant individuals seeking quick gains or innovation.
  • Equities: Broad demographic—retail investors, institutions, retirement funds—all looking for growth or stability.

📌 Takeaway: Know your risk appetite. Your profile can help guide your platform of choice.


💡 QUICK COMPARISON SNAPSHOT

Category Crypto Equities
Market Hours 24/7 Weekdays, business hours
Volatility Very High Moderate to Low
Regulation Light & Evolving Robust & Established
Instruments Innovative (DeFi, NFTs) Diverse (Stocks, ETFs)
Investor Base Younger, speculative Broad, strategic

🧭 FINAL THOUGHT

There’s no one-size-fits-all answer. Crypto and equity markets serve different purposes—and often, the smartest investors diversify across both. Whether you lean into innovation or prefer stability, understanding each landscape is the key to better investing.


📬 Liked this article? Forward it to a friend or colleague who’s exploring new markets.

Want deeper insights like this one?
📩 Come back often to MostExcellentInvestor.com for expert breakdowns and exclusive trend analysis.


For insights into trading stocks specifically see this article: A Beginner’s Fastest Journey to Profitable Stock Trading – Most Excellent Investor

To get a head start (cheat sheet advantage) on your stock research get access to MostExcellentInvester.com profitable stock watchlists here: Sales Information For Silver – Most Excellent Investor

Maximizing Profits: Trading the Stock Market from the Open to the High

Maximizing Profits: Trading the Stock Market from the Open to the High

Trading stocks from the market open to the high of the day is a strategy many traders use to capture early momentum and maximize profits. This approach, often referred to as the "morning rally," is particularly effective because of the high volatility and volume that occur in the first hour of trading. This article will explore why this strategy is advantageous and how traders can execute it successfully.

Why Trade from the Open to the High?

1. High Volatility and Volume

The stock market experiences its most significant price movements in the first hour of trading. This period sees an influx of orders from institutional and retail traders acting on overnight news and pre-market developments. The high liquidity ensures quick order execution and minimal slippage, which is critical for short-term traders.

2. Capturing Early Momentum

The initial price movement in many stocks tends to be the strongest of the day. If a stock opens with positive news or strong pre-market activity, it often experiences a rapid surge, reaching its daily high within the first hour. By targeting this move, traders can capitalize on a substantial portion of the day's price action without staying in the market too long.

3. Reduced Exposure to Risk

Holding positions for extended periods increases exposure to adverse price movements. Trading from the open to the high (which happens early for stocks used in this strategy) allows traders to enter and exit quickly, mitigating the risk of reversals or unexpected news later in the day.

4. Psychological Advantage

By focusing on a short trading window, traders can maintain better discipline and avoid overtrading. Many traders struggle with decision fatigue throughout the day, leading to poor choices. Limiting trades to the morning session enhances clarity and execution.

How to Successfully Trade from the Open to the High

1. Pre-Market Preparation

Preparation is crucial for success in this strategy. Traders should start by:

  • Scanning for stocks with high pre-market volume and significant price movement.
  • Reviewing overnight news, earnings reports, and economic data that could impact stock prices.
  • Identifying key support and resistance levels using technical analysis.
  • Checking market sentiment and futures indices to gauge overall market direction.

2. Identifying the Right Stocks

Not all stocks are suitable for this strategy. The best candidates are those with:

  • High relative volume compared to their average daily volume.
  • A strong catalyst such as earnings reports, news releases, or analyst upgrades.
  • A history of following pre-market trends into the regular session.
  • Sufficient liquidity to ensure quick order execution.

3. Using Technical Indicators

Technical indicators help confirm trade setups and entry points. Some useful indicators include:

  • VWAP (Volume Weighted Average Price): Helps identify whether a stock is trading above or below fair value.
  • Moving Averages: Short-term moving averages (e.g., 9 EMA, 20 EMA) can provide trend confirmation.
  • Momentum Indicators: RSI and MACD can help determine the strength of a move.
  • Pre-market Highs and Lows: These levels often act as support and resistance during the regular session.

4. Executing the Trade

Once the market opens, traders should:

  • Wait for confirmation of the trend rather than entering impulsively.
  • Enter the trade when the stock breaks above key resistance levels with strong volume.
  • Use a stop-loss to limit potential losses. A common placement is just below the pre-market low or a key support level.
  • Scale out of the position as the stock approaches new highs, securing profits while allowing for potential continuation.

5. Exiting at the Right Time

A disciplined exit strategy is as important as a solid entry. Traders should consider exiting when:

  • The stock reaches a predetermined resistance level or percentage gain.
  • Momentum begins to fade, indicated by decreasing volume or bearish candlestick patterns.
  • The broader market starts to reverse or show weakness.

Conclusion

Trading from the market open to the high of the day is a powerful strategy for capitalizing on early momentum, reducing risk, and maximizing profits. By conducting thorough pre-market research, selecting the right stocks, using technical indicators, and executing trades with discipline, traders can significantly improve their success rate. While no strategy is foolproof, mastering this approach can lead to consistent gains and a more structured trading routine.

Want to gain access to a list of stocks researched every night for open to high (OTH) trading? Become a Most Excellent Investor member.


Beginners Guide to Learning Stock Trading Technical Analysis

Learn Technical Analysis (Simplified for Beginners (not Dummies))

Technical analysis is the study of price movements using charts. Unlike fundamental analysis, which looks at company earnings and financials, technical analysis focuses on patterns and trends to predict future price movements.

Why is Technical Analysis Important?

✅ Helps identify the best times to buy and sell stocks.
✅ Allows traders to spot trends and avoid bad trades.
✅ Works for short-term and long-term trading.


A. Understanding Candlestick Charts (Your Trading Roadmap)

Candlestick charts are the most popular way to visualize price movements. Each "candle" represents a specific time period (e.g., 1 minute, 1 hour, 1 day) and shows:

  • Opening Price – Where the stock started.
  • Closing Price – Where the stock ended.
  • High & Low Prices – The highest and lowest prices reached.

👉 Green Candles (Bullish) – The stock closed higher than it opened.
👉 Red Candles (Bearish) – The stock closed lower than it opened.

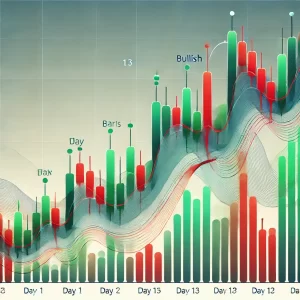
Most Excellent Investor Illustration of Candlestick Chart. The chart shows an overall upward trend with some pullbacks.
The chart shows 1-Day candles on an overall upward trend with some pullbacks.

🔹 Beginner Tip: Focus on daily charts (1-day candles) to start. Shorter timeframes (1-minute, 5-minute charts) are for advanced traders.


B. Key Candlestick Patterns Every Beginner Should Know

1️⃣ Doji – Market indecision; price may reverse soon.

Here is an illustration of the Doji candlestick pattern, highlighting its small or nonexistent body with long wicks, signifying market indecision.


2️⃣ Hammer – Bullish reversal; the stock may go up.

Here is the illustration of the Hammer candlestick pattern, highlighting its small body at the top with a long lower wick, signaling a potential bullish reversal.
Most Excellent Investor illustration of the Hammer candlestick pattern, highlighting its small body at the top with a long lower wick, signaling a potential bullish reversal.


3️⃣ Shooting Star – Bearish reversal; the stock may drop.

Here’s the illustration of the Shooting Star candlestick pattern, highlighting its small body near the bottom with a long upper wick, indicating a potential bearish reversal.
Most Excellent Investor - An illustration of the Shooting Star candlestick pattern. The Shooting Star has a small body near the bottom with a long upper wick, indicating a potential reversal in price.


4️⃣ Engulfing Pattern – A strong signal that a trend is changing.

Most Excellent Investor illustration of the Engulfing candlestick pattern, showing bullish and bearish variations.
Most Excellent Investor illustration of the Engulfing candlestick pattern, both bullish and bearish variations.

🔹 Beginner Tip: Stick to simple patterns like the hammer and engulfing pattern to spot strong trade signals.


C. Support & Resistance (Where Prices Bounce or Break)

  • Support = A price level where stocks tend to stop falling and bounce back up.
  • Resistance = A price level where stocks tend to stop rising and drop back down.

🔹 Beginner Tip: Look for stocks that break through resistance with high volume (more buyers). This is often a good buying opportunity.


D. Simple Indicators to Predict Price Movements

Indicators help confirm trends and trading signals. Here are two beginner-friendly indicators:

1️⃣ Moving Averages (Trend Tracker)

  • Smooths out price movements to show the overall trend.
  • 50-Day & 200-Day Moving Averages – Stocks above these lines are in an uptrend; stocks below are in a downtrend.

2️⃣ Relative Strength Index (RSI) (Overbought/Oversold Indicator)

  • Measures whether a stock is overbought (70+) or oversold (30-).
  • RSI below 30 = Stock might be too cheap and ready to rise.
  • RSI above 70 = Stock might be too expensive and ready to drop.

🔹 Beginner Tip: Use the 50-day moving average to confirm trends and RSI to check if a stock is overbought or oversold before buying.


E. Putting It All Together (Simple Beginner Strategy)

Step 1: Look for a stock trading above the 50-day moving average (Uptrend).
Step 2: Check RSI – If it's near 30, the stock may be oversold (good buy opportunity).
Step 3: Look for a bullish candlestick pattern (like a Hammer) near a support level.
Step 4: Enter the trade and set a stop-loss below support to protect against losses.

🔹 Beginner Tip: Use free charting tools like TradingView or your broker’s platform to practice.


Final Thoughts on Technical Analysis for Beginners

📌 Start Simple – Focus on a few key indicators instead of learning everything at once.
📌 Practice with Paper Trading – Use demo accounts to test strategies before risking real money.
📌 Be Patient – Profitable trading comes from consistency, not guessing.

By following this structured approach, beginners can quickly develop confidence in reading charts and making better trading decisions.

How Technical Analysis fits in the whole endeavor of stock trading.

The above considerations are already contained in Most Excellent Investor researched stock watchlists, which can be accessed here.

A Beginner’s Fastest Journey to Profitable Stock Trading

Here's an introduction to a detailed consideration on the topic of profitable stock trading as a beginner:


A Beginner’s Fastest Journey to Profitable Stock Trading

Stock trading can be highly rewarding, but for beginners, it often feels overwhelming. The good news is that with the right approach, discipline, and mindset, you can accelerate your journey to profitability. This guide will take you through a structured step-by-step process to fast-track your success in stock trading while minimizing common mistakes.


Step 1: Build the Right Mindset

Why Mindset Matters

Many beginners rush into trading with dreams of quick riches, only to suffer losses due to emotional decision-making. Successful traders operate with a disciplined and strategic mindset.

Key Trading Principles to Adopt

  1. Patience Over Greed – The market rewards those who wait for the right setups rather than chasing every opportunity.
  2. Risk Management is Key – Protecting your capital is more important than making profits in the short term.
  3. Consistency Beats Luck – Small, repeatable wins are better than gambling on big, uncertain trades.

Step 2: Learn the Essential Trading Foundations

1. Understand Market Basics

Before placing your first trade, you need to know:

  • Market Participants – Retail traders, institutional investors, hedge funds, etc.
  • Types of Stocks – Growth stocks, value stocks, blue chips, penny stocks.
  • Market Orders & Trading Types – Market orders, limit orders, stop-loss, day trading, swing trading, position trading.

2. Learn Technical Analysis

Technical analysis helps traders predict price movements based on historical data. Key tools include:

  • Candlestick Patterns – Doji, engulfing, hammer, shooting star. Click here for live watchlist of stocks with this pattern.
  • Indicators – Moving averages, RSI (Relative Strength Index), MACD (Moving Average Convergence Divergence), Bollinger Bands.
  • Support & Resistance – Identifying key levels where stock prices are likely to reverse.

3. Learn Fundamental Analysis

While technical analysis focuses on price action, fundamental analysis evaluates a company’s financial health. Key metrics:

  • Earnings per Share (EPS) – Profitability of a company.
  • Price-to-Earnings Ratio (P/E Ratio) – How expensive a stock is compared to its earnings.
  • Revenue Growth & Debt Levels – Indicates a company’s ability to grow sustainably.

Step 3: Choose a Profitable Trading Strategy

1. Day Trading (Fastest But Risky)

  • Buying and selling stocks within a single day.
  • Requires speed, real-time market analysis, and risk management.
  • Suitable for those with time to monitor trades throughout the day.

2. Swing Trading (Best for Beginners)

  • Holding stocks for a few days to weeks to capture short- to medium-term trends.
  • Requires chart analysis and patience but is less stressful than day trading.
  • Works well with technical indicators like moving averages and RSI.

3. Trend Following (Long-Term Profitable Strategy)

  • Buying stocks in an uptrend and selling in a downtrend.
  • Uses moving averages and breakout strategies.
  • Less stressful and requires less screen time than day trading.

Best Strategy for Beginners? Swing trading is the most beginner-friendly way to achieve profitability quickly without the stress of day trading.


Step 4: Open a Trading Account & Start Practicing

1. Choose a Reliable Broker

A broker provides the platform to buy and sell stocks. Key factors to consider:

  • Low fees and commissions – High costs eat into profits.
  • User-friendly platform – Choose one with good charting tools and a mobile app.
  • Paper Trading Option – Allows you to trade with fake money before risking real capital.

2. Set Up a Trading Journal

Keeping a trading journal helps track progress, identify mistakes, and refine strategies. Record:

  • Entry & exit points of trades.
  • Why you entered the trade.
  • Profit/loss outcome.
  • Emotional state during the trade.

Step 5: Implement a Risk Management Plan

Avoiding large losses is the key to long-term success. Here’s how:

  • Only Risk 1-2% of Your Capital Per Trade – Never go all-in on one trade.
  • Always Use Stop-Loss Orders – Set a predefined exit if a trade goes against you.
  • Diversify Your Trades – Don't put all money into one stock or sector.

Step 6: Optimize & Scale Your Trading

1. Analyze Your Trades Weekly

Look at your trading journal and identify what’s working and what’s not.

2. Gradually Increase Capital

Once profitable with a small account, increase your trading capital while maintaining risk management.

3. Automate Strategies (Optional)

Some traders use automated systems to remove emotions from trading. Consider:

  • Using trading bots or alerts to enter trades based on predefined criteria.
  • Setting up notifications for ideal trade setups.

Conclusion: The Fastest Route to Profitability

  1. Master Trading Basics First – Don’t skip learning technical and fundamental analysis.
  2. Choose a Simple & Proven Strategy – Swing trading is often the best for beginners.
  3. Trade with Discipline & Risk Management – Avoid emotional trading.
  4. Refine Your Strategy Over Time – Keep a journal and analyze mistakes.
  5. Gradually Scale Your Profits – Increase capital only after consistent success.

Following this structured approach will significantly shorten your learning curve and help you reach profitability faster than most new traders.


Why Undervalued Stocks Can Be Your Friend and How to Find Them

Why Undervalued Stocks Can Be Your Friend and How to Find Them

Investing in the stock market can be both rewarding and intimidating. Many investors chase high-flying stocks, hoping for rapid gains. However, an often-overlooked strategy involves seeking out undervalued stocks—hidden gems that can offer substantial returns over time. Understanding why these stocks can be your friend and how to find them can help you build a profitable investment portfolio.

Why Undervalued Stocks Can Be Your Friend

  1. Lower Risk with Higher Potential Gains
    Buying stocks at a price lower than their intrinsic value provides a margin of safety. If a stock is already undervalued, the downside risk is often limited compared to over-hyped stocks trading at inflated prices. As the market corrects itself, these undervalued stocks have the potential to rise to their true worth, leading to significant gains.
  2. Market Inefficiencies Create Opportunities
    The stock market is not always rational. Short-term factors such as negative news, economic downturns, or investor sentiment can lead to mis-pricing. Savvy investors who can identify these mis-pricings can take advantage before the rest of the market catches on.
  3. Compounding Wealth Over Time
    Investing in undervalued stocks is often a long-term strategy. As these companies recover or grow, their stock prices appreciate, leading to compounded gains. For investors with patience, this approach can outperform high-risk speculative investing.
  4. Dividend Opportunities
    Many undervalued stocks belong to well-established companies with strong fundamentals. These companies often pay dividends, providing investors with a steady income stream while waiting for the stock price to appreciate.

How to Find Undervalued Stocksov

Finding under valued stocks requires research, patience, and a systematic approach. Here are key strategies to identify them:

  1. Look at Fundamental Metrics
    • Price-to-Earnings (P/E) Ratio: A low P/E ratio compared to industry peers may indicate an undervalued stock.
    • Price-to-Book (P/B) Ratio: A stock trading below its book value can be a sign of undervaluation.
    • Debt-to-Equity Ratio: A strong balance sheet with low debt suggests financial stability.
    • Earnings Growth: Look for companies with consistent revenue and earnings growth despite a low stock price.
  2. Analyze Market Sentiment
    • Stocks may be undervalued due to temporary bad news, but if the company’s fundamentals remain strong, it could be an opportunity to buy.
    • Stocks ignored by analysts and the media may be mis-priced, offering a chance for keen investors.
  3. Use Value Investing Principles
    • Follow strategies used by successful investors like Warren Buffett. Focus on companies with strong business models, competitive advantages, and competent management teams.
    • Look for businesses with a history of stable performance and long-term growth potential.
  4. Check Insider and Institutional Activity
    • If company executives or major institutions are buying shares, it’s often a positive signal that the stock is undervalued.
  5. Screen for Bargains
    • Use stock screening tools to filter companies based on valuation metrics.
    • Compare the company’s current valuation to its historical averages and industry benchmarks.

Final Thoughts

Undervalued stocks can be your best ally in wealth-building, providing a lower-risk way to invest while maximizing returns. By focusing on fundamental analysis, market sentiment, and value investing principles, investors can identify opportunities that others overlook. While patience and discipline are essential, the rewards of investing in undervalued stocks can be substantial over time.

If you’re willing to dig deeper and stay committed, these hidden gems can be your key to financial success in the stock market.

Check out our "Under Valued Stocks Watch List" here.

Share on Reddit


Stock Market Investment Implications of Q1 and Q4 Seasonal Trends and Economic Cycles

Historically, the U.S. stock market has shown a trend called the "Sell in May and Go Away" effect, where the period from November to April has outperformed the period from May to October. This phenomenon has been observed over many years and suggests that stock returns from November through May tend to be higher compared to the summer months.

Economic reports in Q4 and Q1 often appear stronger due to factors like increased holiday spending, year-end corporate investments, fiscal adjustments, tax refunds in Q1, and restocking inventories. These factors boost economic indicators, contributing to seasonal strength in the stock market during these months.

Here's a breakdown of historical performance patterns:

November to April: This period has generally provided higher average returns than the summer months. Analysts speculate that this trend may be influenced by increased trading activity around the holidays and strong economic reports typically released in Q4 and Q1.

May to October: Historically, returns are lower during these months. While not universally negative, the average gains are generally modest. Some theories attribute this to reduced market activity during the summer as traders and investors often take vacations.

Historical Data: According to the Stock Trader's Almanac, between 1950 and 2020, the Dow Jones Industrial Average (DJIA) showed stronger gains from November to April than from May to October. For instance, since 1950, the DJIA gained approximately 7% on average during the November-April period compared to a modest 0.5% average gain during May-October.

Implications: While this pattern has been observed historically, it's essential to note that each year can be different due to factors like interest rates, economic conditions, or geopolitical events. Investors may still find gains in the summer months or might see lower-than-expected returns in winter depending on market conditions.

Why Do Economic Reports Often Appear Stronger in Q4 and Q1?

This is due to several seasonal, fiscal, and behavioral factors, such as:

Holiday Spending: Q4, which includes the holiday season, typically sees a surge in consumer spending as people make purchases for Thanksgiving, Christmas, and New Year’s. Retail sales and consumer spending reports often reflect this increase, boosting overall economic activity and consumer sentiment.

Corporate Investment Cycles: Many companies finalize budgets and investments toward the end of the year, leading to increased spending on capital and resources in Q4. Q1 often benefits as well, as companies begin implementing new projects and investments aligned with their yearly goals.

End-of-Year Fiscal Policies: Governments and corporations sometimes adjust fiscal policies at the end of the year to close out budgets. For example, governments may increase spending to meet annual budget targets, which boosts economic indicators.

Tax Refunds in Q1: In Q1, U.S. consumers start receiving tax refunds, which often translates into increased spending. The infusion of cash can lead to an uptick in retail sales and other economic indicators, providing a lift to the economy in Q1.

Inventory Restocking: Businesses often restock inventories in Q1 after holiday sales in Q4 deplete stock levels. This restocking increases manufacturing and distribution activity, positively affecting economic reports related to production and employment.

Psychological and Behavioral Factors: There’s often a “new year” optimism that bolsters economic outlooks and spending patterns at the beginning of the year. This can lead to higher consumer confidence levels, which are reflected in economic reports.

What does all of this mean for stock market investors?

These patterns contribute to the seasonal strength of economic data in Q4 and Q1, influencing stock market performance usually for the better.

The takeaway from the foregoing? Expect increased trading activity during the holidays and higher consumer and corporate spending. The stock market can yield great profits beginning this month.

Share on Reddit

How can You identify a good growth stock for investment?

Identifying a good growth stock involves evaluating several key factors. Here are 7 steps to help you identify promising growth stocks:

  1. Revenue Growth: Look for companies with consistent and strong revenue growth. This indicates that the company is expanding its market share and increasing its sales.
  2. Earnings Growth: Check the company’s earnings growth over time. A good growth stock should show a steady increase in earnings per share (EPS).
  3. Competitive Advantage: Identify companies with a strong competitive edge, such as unique products, strong brand recognition, or proprietary technology. This helps ensure they can maintain growth over the long term.
  4. Market Trends: Focus on companies that are well-positioned to benefit from long-term market trends. This could include sectors like technology, healthcare, or renewable energy
  5. Management Quality: Evaluate the company’s management team. Experienced and visionary leaders are crucial for driving growth and navigating challenges.
  6. Large Addressable Market: Look for companies with a large and growing addressable market. This provides more opportunities for the company to expand its customer base and increase sales.
  7. Financial Health: Ensure the company has a strong balance sheet with manageable debt levels. This allows the company to invest in growth opportunities without financial strain.

By considering these factors, you can better identify growth stocks with the potential for significant returns. All of these factors are considered for the stocks of Most Excellent Investor watchlists. To see the individual stocks on our watchlists sign up to become a member, or sign in here.

Pay Attention to The Most Relevant Theme for Stock Traders This Summer

The most relevant topic for stock traders can vary depending on current market conditions, but as of late summer 2024, several key themes are prominent:

  1. Interest Rates and Inflation: Central bank policies, particularly those of the Federal Reserve, continue to be crucial. Traders are closely watching for any signals regarding interest rate adjustments and their impact on inflation and economic growth.
  2. Economic Data: Key economic indicators, such as GDP growth, unemployment rates, and consumer spending, are vital for understanding the health of the economy and making informed trading decisions.
  3. Corporate Earnings: Quarterly earnings reports from major companies can significantly impact stock prices. Traders analyze these reports for insights into corporate profitability and future outlooks.
  4. Geopolitical Events: Ongoing geopolitical issues, including trade relations, conflicts, and international sanctions, can create market volatility and influence global stock markets.
  5. Technological Developments: Innovations and trends in technology, such as advancements in artificial intelligence or changes in the tech sector, can drive significant market shifts.
  6. Regulatory Changes: New regulations or policy changes, especially those affecting key industries like finance, healthcare, or technology, can have substantial impacts on stock markets.

Keeping an eye on these topics can help traders stay informed and make more strategic decisions.

While the most important topic for stock traders often depends on the current market context, generally speaking, interest rates and inflation tend to have the most immediate and broad impact on stock markets.

Here's why.

Interest rates, set by central banks like the Federal Reserve, influence borrowing costs, consumer spending, and overall economic growth. Changes in interest rates can affect stock prices directly by altering the cost of capital for businesses and indirectly by impacting investor sentiment and market valuations.

Inflation, on the other hand, affects purchasing power and can lead to changes in central bank policies. High inflation might prompt central banks to raise interest rates to cool the economy, which can have significant repercussions for stocks.

So, while all the topics on the list are crucial, interest rates and inflation often take precedence because of their pervasive influence on the economy and financial markets.

Advantages of Growth Stocks Over Value Stocks

Growth stocks and value stocks represent two distinct investment strategies, each with its own merits and drawbacks. However, growth stocks often present several compelling advantages over value stocks, especially in a rapidly evolving economic landscape.

Higher Potential for Capital Appreciation

One of the most significant advantages of growth stocks is their potential for substantial capital appreciation. Growth companies are typically characterized by high revenue and earnings growth rates, often outpacing the broader market. These companies reinvest their earnings into expanding operations, entering new markets, and innovating products or services. This aggressive reinvestment strategy can lead to exponential growth in stock prices over time, offering investors the chance to realize significant returns. For instance, tech giants like Amazon, Apple, and Tesla have demonstrated remarkable growth trajectories, providing early investors with substantial profits.

Innovation and Market Leadership

Growth stocks are often at the forefront of innovation, leading to market leadership in their respective sectors. Companies that focus on growth tend to invest heavily in research and development, pushing the boundaries of technology and setting industry standards. This innovation not only helps in capturing market share but also creates high barriers to entry for competitors. Firms like Alphabet (Google) and Nvidia have leveraged their innovative capabilities to dominate their markets, offering investors robust growth opportunities linked to cutting-edge technologies like artificial intelligence, cloud computing, and autonomous driving.

Favorable Economic Conditions

Growth stocks typically perform well in favorable economic conditions characterized by low interest rates and robust consumer spending. In such environments, investors are willing to pay a premium for companies with strong growth prospects, driving up stock prices. For example, the post-2008 financial crisis period saw an extended low-interest-rate environment, which significantly boosted the performance of growth stocks, particularly in the technology sector.

Strong Earnings Momentum

Companies with strong earnings momentum are often classified as growth stocks. These companies consistently deliver better-than-expected earnings results, which can lead to positive revisions in analysts' estimates and upward stock price movements. Earnings momentum attracts investors looking for continuous performance improvement, creating a positive feedback loop that further enhances stock value.

Higher Returns in Bull Markets

Growth stocks tend to outperform value stocks during bull markets. In times of economic expansion, growth companies benefit from increased consumer and business spending, leading to higher sales and earnings. This dynamic was evident during the prolonged bull market from 2009 to early 2020, where growth stocks, particularly in the tech sector, outperformed the broader market. The NASDAQ Composite Index, which is heavily weighted towards growth stocks, significantly outpaced other major indices during this period.

Demographic and Technological Trends

Long-term demographic and technological trends favor growth stocks. The increasing digitization of the economy, the rise of e-commerce, advancements in biotechnology, and the adoption of renewable energy sources are all trends that benefit growth companies. These firms are often well-positioned to capitalize on shifting consumer behaviors and technological advancements, offering sustained growth potential over the long term.

Conclusion

While value stocks have their own set of advantages, such as lower volatility and attractive dividends, growth stocks offer compelling benefits, particularly for investors seeking higher returns and exposure to innovative sectors. The potential for substantial capital appreciation, market leadership through innovation, favorable economic conditions, strong earnings momentum, superior performance in bull markets, and alignment with long-term demographic and technological trends make growth stocks a valuable addition to a diversified investment portfolio. Investors should, however, remain mindful of the higher risk associated with growth stocks, as these can be more volatile and sensitive to market fluctuations. Nonetheless, with careful selection and strategic investment, growth stocks can provide significant rewards.

Suggested For You: Most Excellent Investor daily watchlists | top stock in both growth and value stocks are supplied daily.